Executive Summary:
- When the Environmental Protection Agency (EPA) revised current ozone emission standards in 2015, the agency’s regulatory impact analysis failed to quantify production losses for manufacturing.
- This study leverages the EPA’s attainment threshold to show that current ozone regulations lower revenues for manufacturing firms by an average of $277 million annually.
- Findings indicate that the EPA’s impact analysis underestimates realized economic effects, generating both economic and regulatory policy implications.
Introduction:
As the Trump Administration reviews Environmental Protection Agency (EPA) regulations, findings provide crucial evidence for reassessing the current ground-level ozone emission standards (2015). The most recent standards of acceptable ozone emissions come from the EPA’s revision of standards in 2015, lowering the threshold from 0.076 to 0.071 parts per million (ppm). Within this revision, the agency’s Regulatory Impact Analysis (RIA) failed to quantify production impacts to manufacturing firms. The EPA deemed such cost estimates “not possible,” to derive, leaving a critical gap in understanding the regulation’s economic impact. When deriving this production gap, it is important to understand that regulatory burdens typically incentivize firms to divert resources toward compliance, rather than productive operations, resulting in reduced revenue generation. To support this point, the analysis quantifies the revenue impact on U.S. manufacturing firms using newly available post-2015 data. Exploiting the 0.071 ppm ozone threshold allows for the implementation of a regression discontinuity design (RDD) to quantify such impacts. By utilizing this methodology, this study finds that ozone emission regulations cut nationwide manufacturing revenues by $277 million. Derived production losses, absent from the EPA’s original impact assessment, suggest the agency significantly underestimated the regulation’s economic burden.
Institutional Background:
Following the EPA’s 2015 update to emission standards, the agency issued a revision to ozone (O3) emission standards, reducing the attainment level from 0.076 to 0.071 ppm.1 This attainment designation determines if a county is regulated and to what extent by the EPA. Appendix A outlines the nonattainment levels.
By and large, ground-level ozone emissions are primarily caused by manufacturing firms, with a smaller percentage originating from transportation vehicles. Therefore, burdens are passed onto respective firms, requiring them to adopt a state implementation plan (SIP) to lower emissions. Consequently, the EPA was required to perform a cost-benefit analysis (CBA) of the final rule, quantifying the regulatory impact on affected firms. In this CBA, the EPA failed to quantify the economic impact of regulations, stating that it was “not possible to quantitatively conclude.” This study seeks to reevaluate cost estimation through primary source data analysis. Analysis begins with transportation manufacturing (NAICS 336), and is justified as a starting point in Appendix B.
Literature Review:
The use of an RDD for measuring the impact of EPA regulations is far from a new endeavor; numerous prior studies have emerged on the topic. Stanley (2017) conducts a similar RDD study on the impact of 1997 NAAQS ozone levels (threshold of 0.085 ppm). He finds significant decreases in employment and the number of firms within nonattainment counties. Similar RDD papers from Walker (2013), Greenstone (2002), Henderson (1996), and List et al. (2004) explore similar questions with differing outcomes of interest. These papers find similar conclusions to those of Stanley (2017). Although RDDs are utilized for RIA, previous literature fails to account for production losses from recent ozone regulations.
Therefore, this study looks to revisit the findings of Stanley (2017) and the EPA (2015) to determine if the revision of ozone regulations has impacted manufacturing firms, focusing primarily on revenue.
Data and Methodology:
This revised impact analysis draws from two main sources of data from 2017 to 2021, inclusive. Emissions data is drawn directly from the EPA’s Air Quality Statistics Report, which breaks emissions down by county and year.2 Economic manufacturing data is sourced yearly from the County Business Patterns database.3 Appendices C and D present summary statistics as well as definitions for treatment and control counties, respectively.
Figure 1 displays treated and control counties, as well as counties that do not report emissions data due to insignificant ozone levels for the most recent year in the data, 2021. Treatment definitions are provided by Model 1. An interactive version of this figure can be found here.
Figure 1: Counties in Attainment vs Nonattainment (2021)
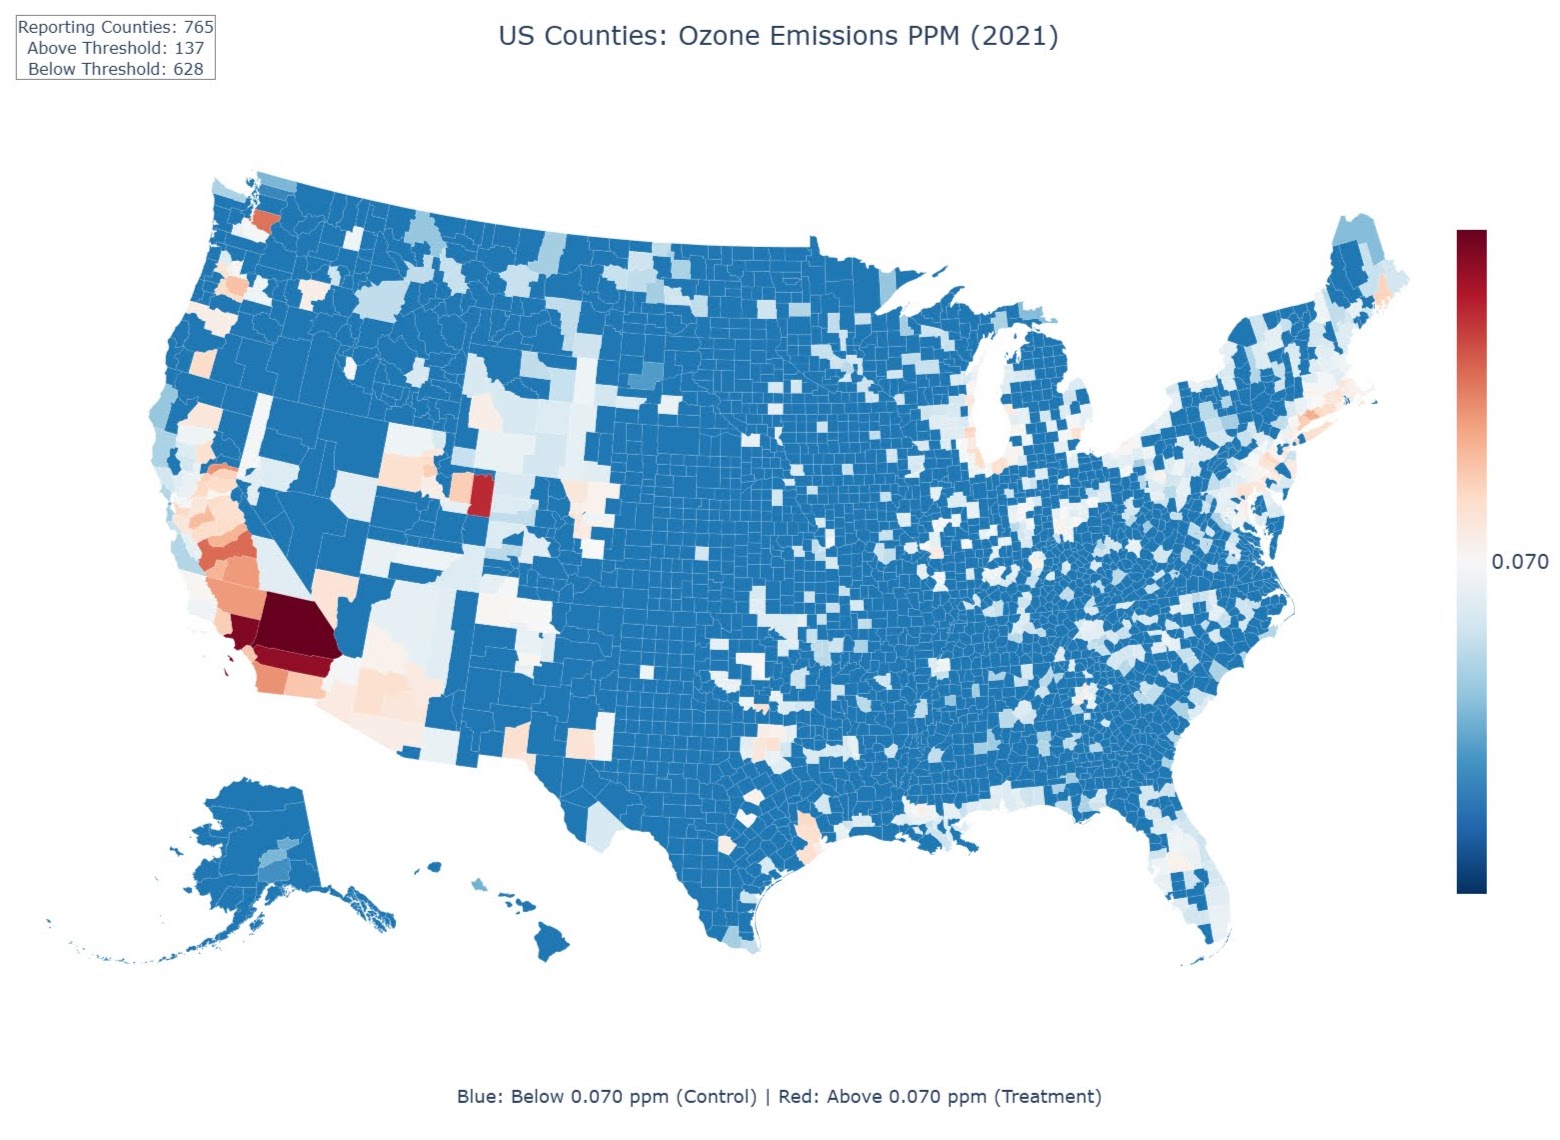
Using this definition of treatment, RDD modeling can be derived and implemented using Model 2.4 Appendix E details model specifications and interpretations of modeling.
Results:
Model 2 was estimated on several outcomes to better capture the economic impact caused by EPA regulatory burdens. For interpretable visuals and a clear understanding of relationships, Table 3 in Appendix F displays regression results for only the transportation manufacturing sector.
As expected from previous literature, there is a significant decline in revenue and firms for nonattainment counties. Nonattainment counties lose an average of $7.686 million in annual revenue, according to level estimation. Furthermore, logarithmic estimation shows an annual decrease in revenue of 2.62 percent.5 Table 3 regression results and local average treatment effect, around the regulation cutoff, can be seen in Figure 2.
Figure 2: RDD Between Revenue and Emissions at the Ozone Attainment Threshold

Although not the core focus of conclusions, RDD results reveal that employment sees no statistically significant impact from nonattainment regulation, and furthermore sees no impact from emissions as well. On the contrary, revenue and firms see significant decreases from treatment effects. Additionally, results remain strong when testing external validity to other subsets of manufacturing. Although the magnitude of effects differs, the negative effect of EPA regulation on both revenue and firms still holds across a vast majority of manufacturing industries. When including all subsets of manufacturing in Model 2, on average, counties see an annual revenue decrease of $2.02 million (p-value < 0.001).6
For national estimation, a zero-mean treatment effect is assumed for counties without permanent emissions reporting. This implies that EPA regulations had no directly measurable economic impact in these counties.7 Therefore, national level impact analysis from Model 2 multiplies average costs by total treated counties (2.02 × 137). Results indicate total costs of $238 to $316 million (95% CI) across all manufacturing sectors. This empirical estimate places a true production impact of ozone regulations on manufacturing firms, an estimate that the EPA previously failed to identify or even hint at the direction of its effect.8
Limitations and Future Research:
Beyond aggregate revenue costs, results indicate that the number of firms in a county faces a significant decline when subject to ozone regulations. However, it is difficult to pinpoint the causal behavior behind this interaction. Could these firms be moving to avoid regulations? Could these firms be going out of business from regulation? Previous literature seems to explain this interaction as firms relocating to attainment counties, as found by Henderson (1996) and List et al. (2004).
Additionally, employment shows no effect from regulation treatment, a finding which contradicts previous research from Walker (2013) and Greenstone (2002). Again, the root of this insignificant interaction is unclear; could firms be allocating employees to additional regulatory responsibilities? Could sticky employment outweigh the effects of regulation burdens? Under this methodology, these questions are difficult to answer; hence, additional research would be needed. Although these effects can be complex, the costs imposed on firms by regulatory burdens provide a more straightforward measure of the impact on production.
Economic Implications and Policy Recommendations:
The EPA was unable to indicate a production loss from the 2015 revision of ozone standards, focusing instead on an attempt to estimate direct engineering costs alone. With new manufacturing data available, post-2015, this revised RIA quantifies the manufacturing production decline under the treatment of nonattainment. Although findings develop the EPA RIA literature, they also replicate similar, pre-2015 findings (Stanley 2017), which find regulations on ozone emissions are harmful to manufacturing.
Conclusions from RDD modeling find that the transportation sector realizes an average annual loss of $7.86 million (per county) from ozone regulations. Additionally, manufacturing, as a whole, realizes an annual loss of $2.016 million per county, on average. Subsequently, ozone regulation nationwide costs manufacturing firms a sum of $277 million annually (± $39 million), on average. This decrease in revenue likely stems from firms being forced to slow production and spend additional resources to comply with EPA requirements. As firms allocate resources away from production tasks, they shift down the production function, consequently becoming less efficient. Additionally, it is expected that results will not be uniform across all firms. Large manufacturing firms would take significantly larger losses compared to the average firm, more attuned to that of a 2.62 percent decrease in revenue, as seen in Table 3.
Furthermore, modeling and analysis does not account for spillover effects, for example, additional firms that rely on the production of respective manufacturing firms. These spillover effects likely inflate the true economic burden, suggesting actual costs may be considerably greater than those captured in the analysis. Further research using dynamic modeling could aim to measure regulatory spillover effects. Similar to the findings of Zhou et al. (2021), who states, “failure to account for spillovers can lead to significant underestimation of program impacts.” All in all, core findings of this impact analysis point to the EPA’s underestimation of economic costs from the revision of ozone standards (2015). However, policy outlooks are not limited to only the EPA. Looking beyond ozone emissions, the current regulatory review process should incorporate ongoing monitoring of economic impacts to capture effects that may be unquantifiable during initial rulemaking.9
Appendices:
Appendix A: Nonattainment Designation Levels
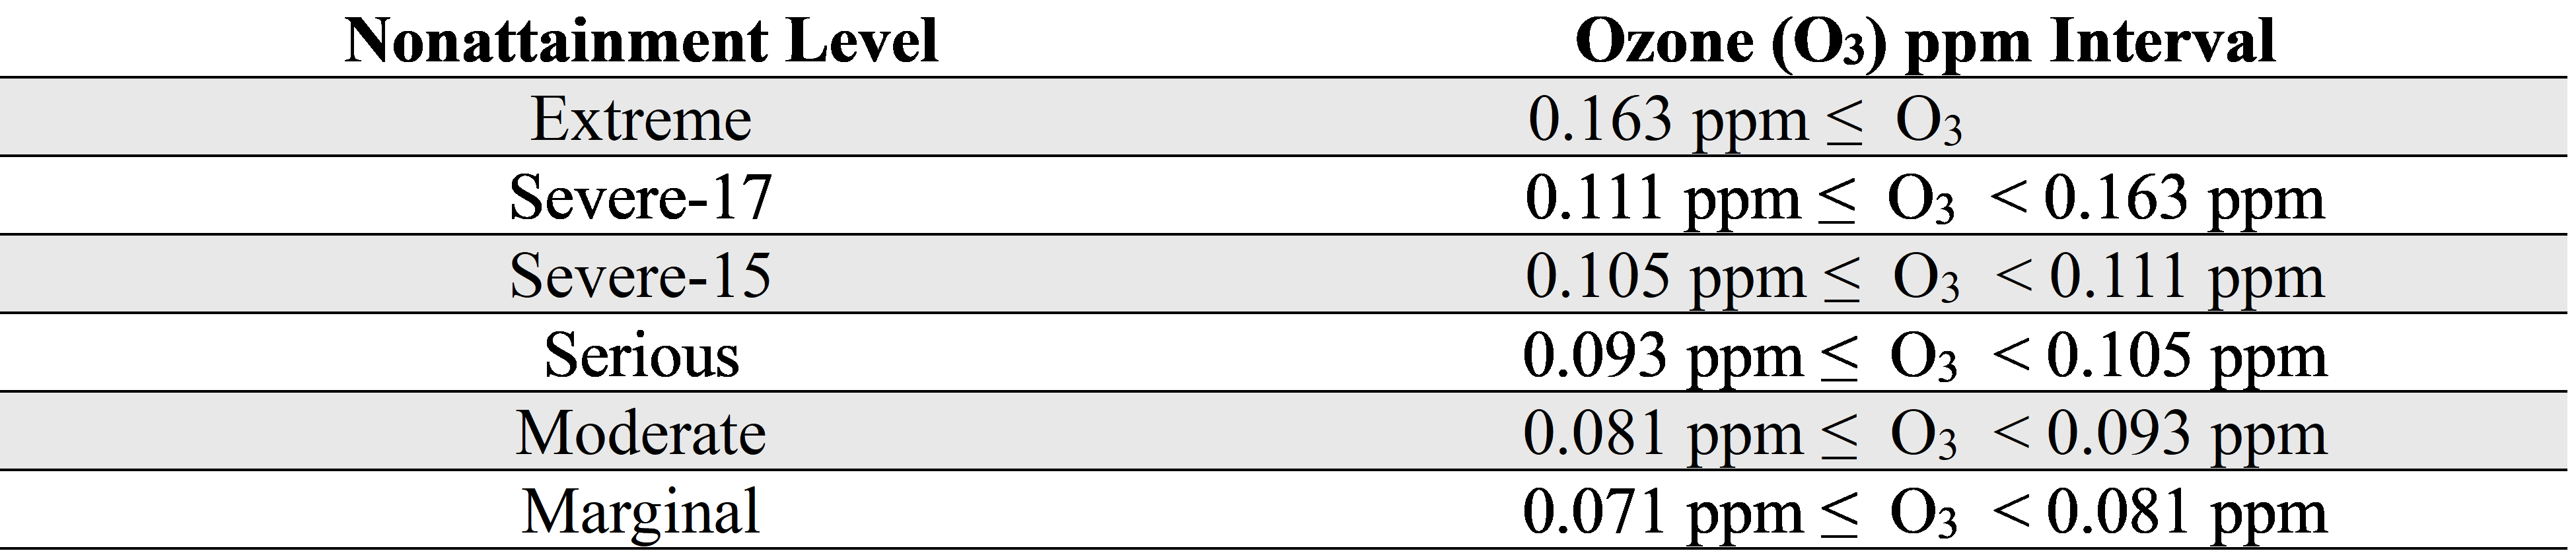
Under the 2015 emissions threshold, counties across the United States were reevaluated to determine if they meet National Ambient Air Quality Standards (NAAQS). Counties designated as nonattainment were given a ranking of nonattainment based on their recorded ozone ppm, as seen below in Table 1.
Table 1: Ozone Nonattainment Designation Levels
Appendix B: Transportation Manufacturing
As a starting point for analysis, transportation manufacturing is chosen because preliminary modeling revealed it shows the strongest empirical relationship between regulation and economic outcomes. Additionally, analysis reveals that transportation manufacturing both emits a significant amount of ozone (ppm) and accounts for a sizable share of manufacturing revenues in the United States. Nonetheless, the analysis extends to all manufacturing subsets to estimate a nationwide treatment effect.
Appendix C: Summary Statistics
Table 2: Transportation Manufacturing County Summary Statistics (N = 997)

Table 2 presents summary statistics for transportation manufacturing counties. Initial summary statistics reveal large outliers throughout the data. Therefore, to ensure generalized predictions under RDD modeling, outliers (defined as the 1st and 99th percentiles) have been trimmed from the data.
Appendix D: Definition of Treatment
As identified previously, methodology employs the use of an RDD to capture the effect of ozone regulation around the cutoff value of 0.071 ppm, as defined by NAAQS. Therefore, a definition for treatment counties (c) at time (t) can be derived from Model 1.
Model 1: Definition of Treated Counties

Appendix E: Model Specifications
More specifically, this modeling uses a global RDD. This approach is appropriate because treatment, being designated as ‘nonattainment’, does not occur sharply at the 0.071 ppm ozone threshold. Instead, ozone levels vary around this cutoff, so not all counties just above the threshold are treated, and not all just below are untreated. Global RDD methodology for this study comes from Opper and Ozek (2024).
Additionally, to improve the precision of estimates, the model applies weighted least squares instead of ordinary least squares.10 Furthermore, Model 2 allows for two separate regression lines between the respective treated and control counties. This allows for the comparison of counties just above and below ozone thresholds; in theory, these counties should be very similar. The model includes a treatment variable of interest, ‘Treatment’, which indicates the average discontinuity, or ‘jump’, caused by the regulatory treatment.11
Model 2: Weighted RDD with Year Fixed Effects

Appendix F: Regression Table
Table 3: County Level RDD Estimates for Transportation Manufacturing (NAICS 336)

Footnotes:
- Ground-level ozone has long been a focal point of EPA air quality regulation, with continuous updates to the definition of unsafe levels. ↩︎
- The data has been adjusted for external extreme events, as designated by the EPA itself. Extreme events include but are not limited to wildfires, hurricanes, and severe storms, which would create bias toward counties that see these events at an increased rate. ↩︎
- Data is held constant with that of the NAAQS emission standards and the EPA’s implementation timeline. Consistent data standards include ozone emissions within the EPA data being coded as the yearly average of ozone ppm per 8-hour continuous period, for consistency with NAAQS. As well as data ranging from 2017 to 2021, which aligns with the EPA’s implementation timeline. ↩︎
- More specifically, modeling uses a global RDD. This approach is appropriate because treatment, being designated as ‘nonattainment’, does not occur sharply at the 0.071 ppm ozone threshold. Instead, ozone levels vary around this cutoff, so not all counties just above the threshold are treated, and not all just below are untreated. Global RDD methodology for this study comes from Opper and Ozek (2024). ↩︎
- Important to note that revenue losses do not account for additional engineering costs, listed in the original CBA by the EPA. ↩︎
- This metric falls below that of the transportation sector, likely because additional sectors emit much less emissions and would not be subject to SIP. ↩︎
- This should not be a contested assumption given that the EPA does not regulate these counties, meaning treatment should not have a direct effect. Although it is plausible that negative spillover effects from neighboring counties could affect these jurisdictions, indicating results could be a lower bound of the true regulatory burden. ↩︎
- Also important to note, for validity, additional placebo outcome variables were tested to ensure robustness of the model. Population, demographics, and income all converged to have a non-significant treatment effect, holding the model to be robust under this restricted methodology. Placebo cutoff points are also tested to ensure results hold true only at the 0.071 ppm threshold. ↩︎
- As Wuepper and Finger (2022) observe, “RDDs are increasingly being employed in agricultural and environmental economics to identify causal effects.” Federal agencies should likely adopt RDD methodologies as standard practice for post-implementation regulatory assessment. ↩︎
- Weights are calculated following Romano and Wolf (2016) as the inverse of fitted variance from an auxiliary regression of squared OLS residuals. ↩︎
- Model 2 also accounts for fixed effects (γt) between years (t) to avoid noise between the multiple years that are included within the data. ↩︎

You must be logged in to post a comment.