As discussed in the preceding post, U.S. immigrant integration efforts occur mainly at the state and local level, with mixed success rates among various groups. However, as demonstrated by Figure 13, immigrants in the U.S. are more assimilated than in most European countries:
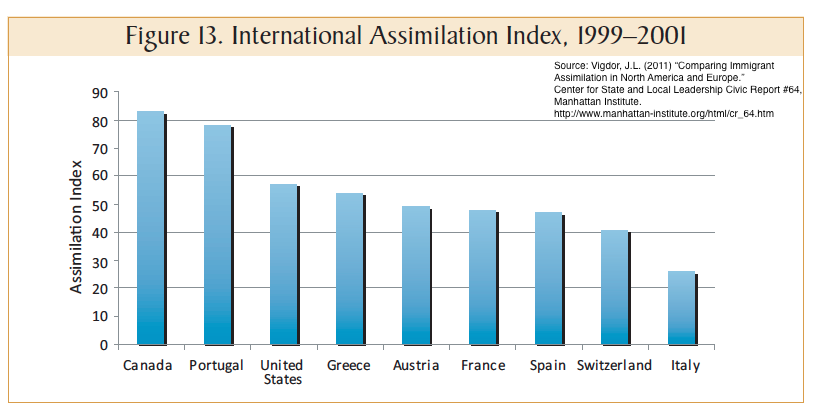
Still, U.S. immigrant integration has room for improvement, according to the Migration Integration Policy Index (MIPEX), which rates and compares 31 countries across Europe, Canada, and the U.S. on 148 policy indicators that include access to education, political participation, and labor market mobility. The country with the highest score was Sweden, followed by Portugal, and Canada in third place. The U.S. ranked ninth, scoring 62 points out of a total of 100.[1]
Canada, a country that prides itself on its multiculturalism and consistently ranks in the top in terms of overall assimilation, serves as an interesting model for the U.S. to study and potentially emulate. In doing so, it is important to note that the two countries have different economic circumstances, migration patterns, and respective sizes of various immigrant groups[2], all of which influence immigration policy and integration outcomes.
Unlike the U.S., Canada has an aging population, which means that immigrants are viewed as a driver of population growth. As a result, the country has focused on recruiting well-educated and skilled immigrants that can boost its economy. This translates to greater emphasis on immigrant integration and programs that facilitate the transition to Canadian society and the labor force. Secondly, because Canada’s only border is with the United States, it does not have a huge illegal immigrant population, which facilitates assimilation efforts.
One example of the two countries’ differing approaches to immigrant integration is the path to citizenship. Compared to the U.S., Canada has a high rate of naturalization because the path to citizenship is relatively short. Foreigners only face a 3-year residence requirement as opposed to 5 years for permanent residents in the U.S. The U.S. immigration system is also notorious for its processing delays and massive backlogs, resulting in even longer waiting times. As a result, more than 70 percent of Canadian immigrants are naturalized citizens, compared to 46 percent in the U.S.
Unsurprisingly, Canada engages in extremely detailed integration planning through its own Canadian Immigrant Integration Program (CIIP). Launched as a pilot project in 2007 and transformed into a full-fledged program in 2010, CIIP provides free departure orientation to soon-to-be departing immigrants who are still overseas. The program helps immigrants and their dependents by providing them with information about employment prospects and job searches, as well as personalized planning tools from Canadian partner organizations.
Overall, the program has been successful in enabling future immigrants to better prepare for their move and meet various language and skill requirements that they need to achieve economic integration in Canada. To date, more than 9,000 immigrants have graduated from the CIIP, with almost 76 percent “strongly agreeing” that their understanding of how to find suitable work in Canada improved as a result of the program.
Policy Implications
The U.S. immigration policy debate and future reforms should dedicate greater attention to developing immigrant integration programs and services. Successfully integrating immigrants fuels their success, strengthens communities, and bridges gaps between newcomers and their communities.
Not only would improving the U.S. integration system help its immigrant population, but it would serve the country’s economic interests too.
Research by Richard Florida and Charlotta Mellander found that nations that are better at integrating new immigrants have higher levels of economic growth and development, overall economic competitiveness, rates of entrepreneurship, and happiness and life satisfaction:
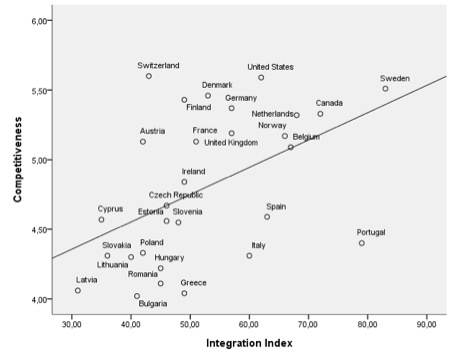
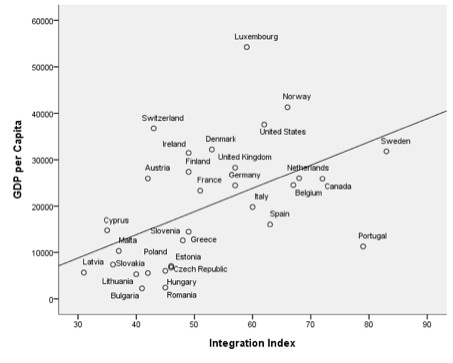
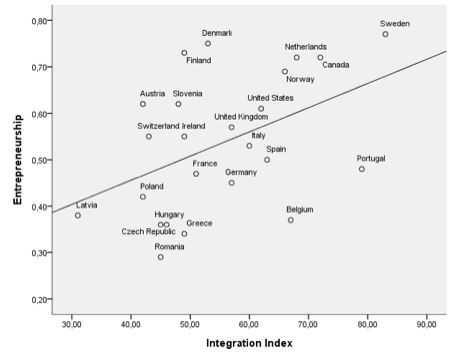
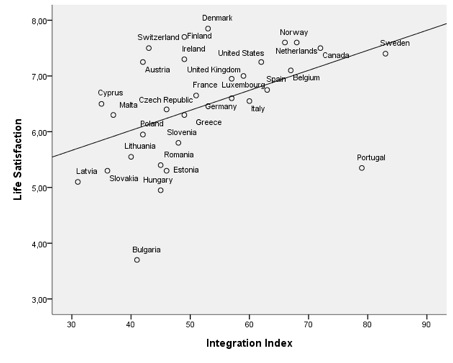
Note that in these scatter charts, a country’s MIPEX score’s relationship to various economic indicators of prosperity does not necessarily imply a causal relationship. It is very likely that strong economic indicators are the cause of higher integration, rather than the result. Nevertheless, the association is intriguing.
Although the U.S. remains a top destination choice for many immigrants, the MIPEX suggests that there is more to be done to help them successfully integrate into society and achieve their full potential. As U.S. policymakers struggle to reform the immigration system, potential future legal immigrants may choose to take their diverse skills, energy and ambition elsewhere.
While it would be difficult to replicate Canada’s intensive immigration planning program, improving the U.S. immigrant integration policy is certainly possible. Fortunately, it does not require reforming any existing laws, but rather greater coordination and resource planning among various government agencies and states.
Possible solutions suggested by Mary Giovagnoli, Director of the Immigration Policy Center, include the establishment of an Office of Immigrant Integration within the White House or an expansion of the Office of Citizenship. Another consideration would be identifying an existing, suitable federal agency that could supervise the distribution and use of federal funds in states for immigrant integration purposes. Regardless of how it’s done, the initiative should allow states to leverage resources to promote greater integration, particularly in “new destination” states experiencing increasing waves of immigrants.
Successful immigrant integration has the potential to shape public attitudes towards immigrants and countervail any lingering prejudices about them. The breaking of this mental barrier can then inspire future policymakers and legislators to design smart, forward-thinking immigration laws that produce lasting, positive effects.
[1] This map shows the MIPEX scores for the 31 countries for 2010.
[2] Jacob L. Vigdor of the Manhattan Institute for Policy Research does a useful comparison of the relative integration performance of specific immigrant groups in different countries.

You must be logged in to post a comment.