Executive Summary
- Intra-BRICS trade was growing well before recent trade tensions, but U.S tariff escalations have accelerated efforts by BRICS+ members to diversify away from U.S.-centered trade.
- Trade among BRICS countries increased from $84 billion in 2003 to $1.17 trillion in 2024, at an annual rate of 13.3 percent—more than twice the pace of global trade growth.
- BRICS+ countries are increasingly strengthening trade, investment, and institutional links with one another, to a hedge against future disruptions in the U.S. market, potentially resulting in weakened U.S. dollar dominance and leverage over global commerce.
Introduction
Trump’s tariffs were intended to reduce U.S. dependence on strategic competitors and redirect trade flows back toward the United States. In practice, they have also encouraged many emerging economies to diversify their economic relationships. As tariffs increase the cost and uncertainty of relying on U.S. markets, countries have expanded trade with alternative partners, particularly within the BRICS+ network, to reduce exposure to future disruptions. Rather than signaling deglobalization, this shift reflects a broader reorientation of trade towards a variety of markets and suppliers.
What is BRICS+?
BRICS+ is an informal coalition of ten emerging economies that, despite having competing geopolitical interests, share a common goal in countering Western-dominated institutions. The group organized in 2009 starting with Brazil, Russia, India, and China; plus, the induction of South Africa in 2010. Following invitations extended at the 2023 Johannesburg summit, Egypt, Ethiopia, Iran, and the United Arab Emirates became full members effective January 1, 2024. Indonesia joined separately, on January 6, 2025, transforming the group into BRICS+. Saudi Arabia has not finalized its full membership, although formally invited to join in 2023.
The combined bloc now represents approximately 3.9 billion people, roughly 48 percent of the world’s population, compared to the Group of Seven (G7) at roughly 10 percent. While G7 still generates a larger share of global economic output in nominal terms, about $54.5 trillion in combined GDP compared to BRICS+’s $32 trillion, the picture changes when output is measured using purchasing power parity (PPP), which accounts for differences in local prices and living costs. Figure 1 illustrates the steady rise in BRICS+’s share of global GDP relative to the G7 from 2000 to 2025 on a PPP basis.
This growth reflects more than the bloc’s demographic scale, as it highlights a broader shift in the global economy. Although the G7 remains the world’s most advanced economic grouping, BRICS+ economies are expanding at a significantly faster pace. Real GDP growth across BRICS+ averages roughly 4 percent annually, compared to 1 to 1.5 percent among G7 economies. Taken together, these trends suggest that an increasing share of global economic activity is being driven by emerging markets, gradually reshaping the balance of economic influence in the international system.
Figure 1: Combined gross domestic product (GDP) in purchasing power parity (PPP) of the BRICS Plus and G7 countries from 2000 to 2025
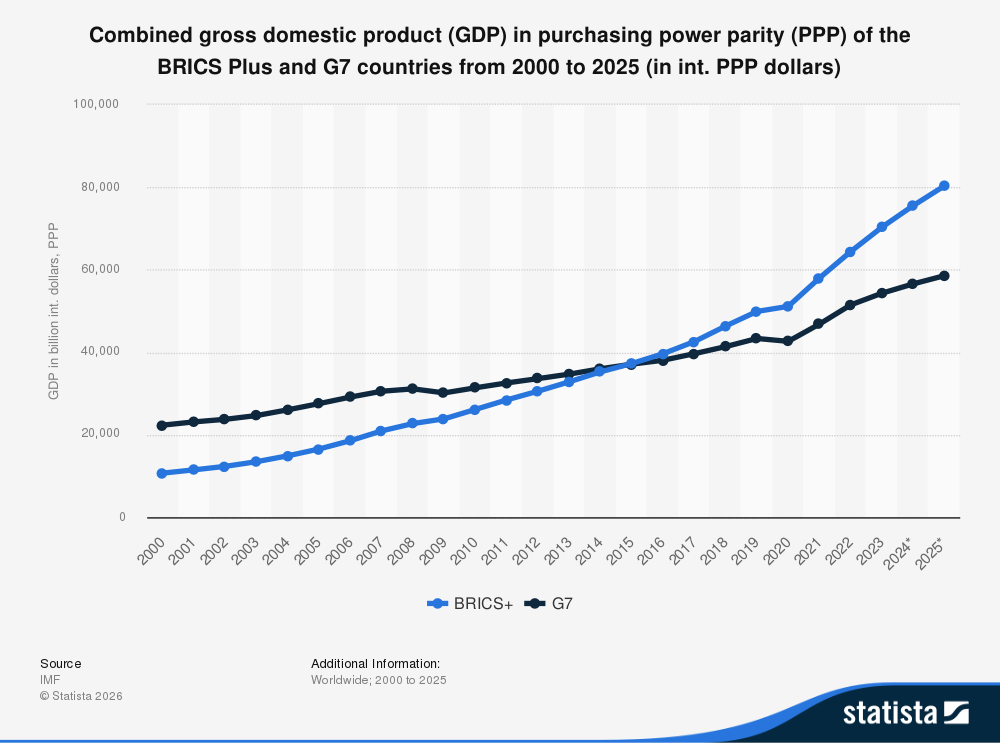
Source: Statista
The First Tariff Wave
While BRICS+ economies were already increasing their share of global output before 2018, the U.S.-China trade war appears to have reinforced the bloc’s underlying trajectory. Tariffs encouraged firms and governments to diversify trade relationships, deepen ties with alternative markets, and reduce reliance on traditional Western economic partners. As a result, Trump’s tariffs functioned less as a barrier to BRICS+ growth and more as an accelerant of economic and trade patterns that were already emerging.
The first Trump administration’s 2018 Section 301 tariffs on Chinese goods, imposed an initial tariff rate ranging from 7.5 to 25 percent on approximately $370 billion worth of Chinese imports, acting as the original pressure test in the U.S.-China trade war. As a countermeasure, China announced a 25 percent retaliatory tariff on U.S. soybeans, among other commodities. The Phase One Agreement in early 2020 was partly designed to claw some of the market back. As part of the agreement, China committed to purchase at least $200 billion worth of U.S. goods between 2020 to 2021 to combat the U.S. trade deficit with China. However, structural issues arose, and China ultimately fulfilled only about 60 percent of its goods commitment and approximately 57 percent of its combined goods and services commitment.
The Second Tariff Wave
The second Trump administration applied pressure on BRICS+ nations far more broadly and with a more explicitly political edge. In addition to existing tariffs on China, President Trump, in July 2025, threatened a blanket 10 percent tariff on any countries aligning themselves with BRICS+’s anti-American policies — most notably the bloc’s expansion of bilateral trade in local currencies, shifting away from the U.S. dollar. Furthermore, in July 2025, the Trump administration launched a Section 301 investigation into Brazil’s “Unreasonable Acts, Policies, and Practices,” burdening U.S. commerce. The proposed tariff would be a 25 percent ad valorem tax on all goods with some exceptions on select goods.
Beyond Brazil, the administration pursued a broader, multi-pronged approach across the bloc. The administration further adjusted Section 232 tariffs on steel and aluminum at a global scale, impacting several BRICS+ members, while looking ahead to the expiration of the Section 122 tariffs in late July 2026. Anticipating the lapse, USTR initiated Section 301 investigations intend to serve as a replacement tariff authority. The Section 301 investigation into forced labor practices proposes tariffs ranging from 10-12.5 percent on 86 countries, including multiple BRICS+ nations, found to be in violation of labor practices hurting U.S. commerce. The forced labor proposed tariffs would stack on top of any existing tariff rates already in place.
Taken together, the second Trump administration’s tariff strategy represents a significant escalation from the first term, targeting BRICS+ members more directly and with a more explicit geopolitical objective. Rather than focusing solely on correcting specific trade imbalances, the strategy seeks to increase the cost of de-dollarization efforts and deeper economic coordination among BRICS+ economies.
How Tariffs Create Incentives for BRICS+ Cooperation
For the past two decades, intra-BRICS trade has grown from $84.2 billion in 2003 to $1.17 trillion in 2024 on the export side, a compound annual growth rate of 13.3 percent, more than double the 5.7 percent growth rate of global trade over the same period. While BRICS+ members often pursue competing geopolitical and economic interests, rising tariffs and broader trade restrictions have increased the cost, uncertainty, and political risk associated with concentrated reliance on the U.S. market. As a result, export-oriented economies have been incentivized toward alternative markets that offer lower trade barriers and more predictable market conditions, contributing to continued growth of the trade coalition.
The agricultural market illustrates one of the primary examples of strategic diversification following the escalation of U.S.-China trade tensions and retaliatory tariffs beginning in 2018. U.S. soybean exports to China declined sharply, falling from $12.3 billion in 2017 to $3.1 billion in 2018 as retaliatory tariffs took hold. This created an immediate supply gap in one of China’s most strategically important import categories. China imports roughly 100 million tons of soybeans annually, and Brazil rapidly absorbed the displaced demand, emerging as the dominant supplier. This structural shift is visible in Figure 2, which shows Brazil’s share of China’s soybean imports rising steadily after 2018 while the U.S. share contracts from roughly one-third of imports in the mid-2010s to about 21 percent by 2024, with Brazil expanding to over 70 percent.
Figure 2: China’s Soybean Imports (metric tons)
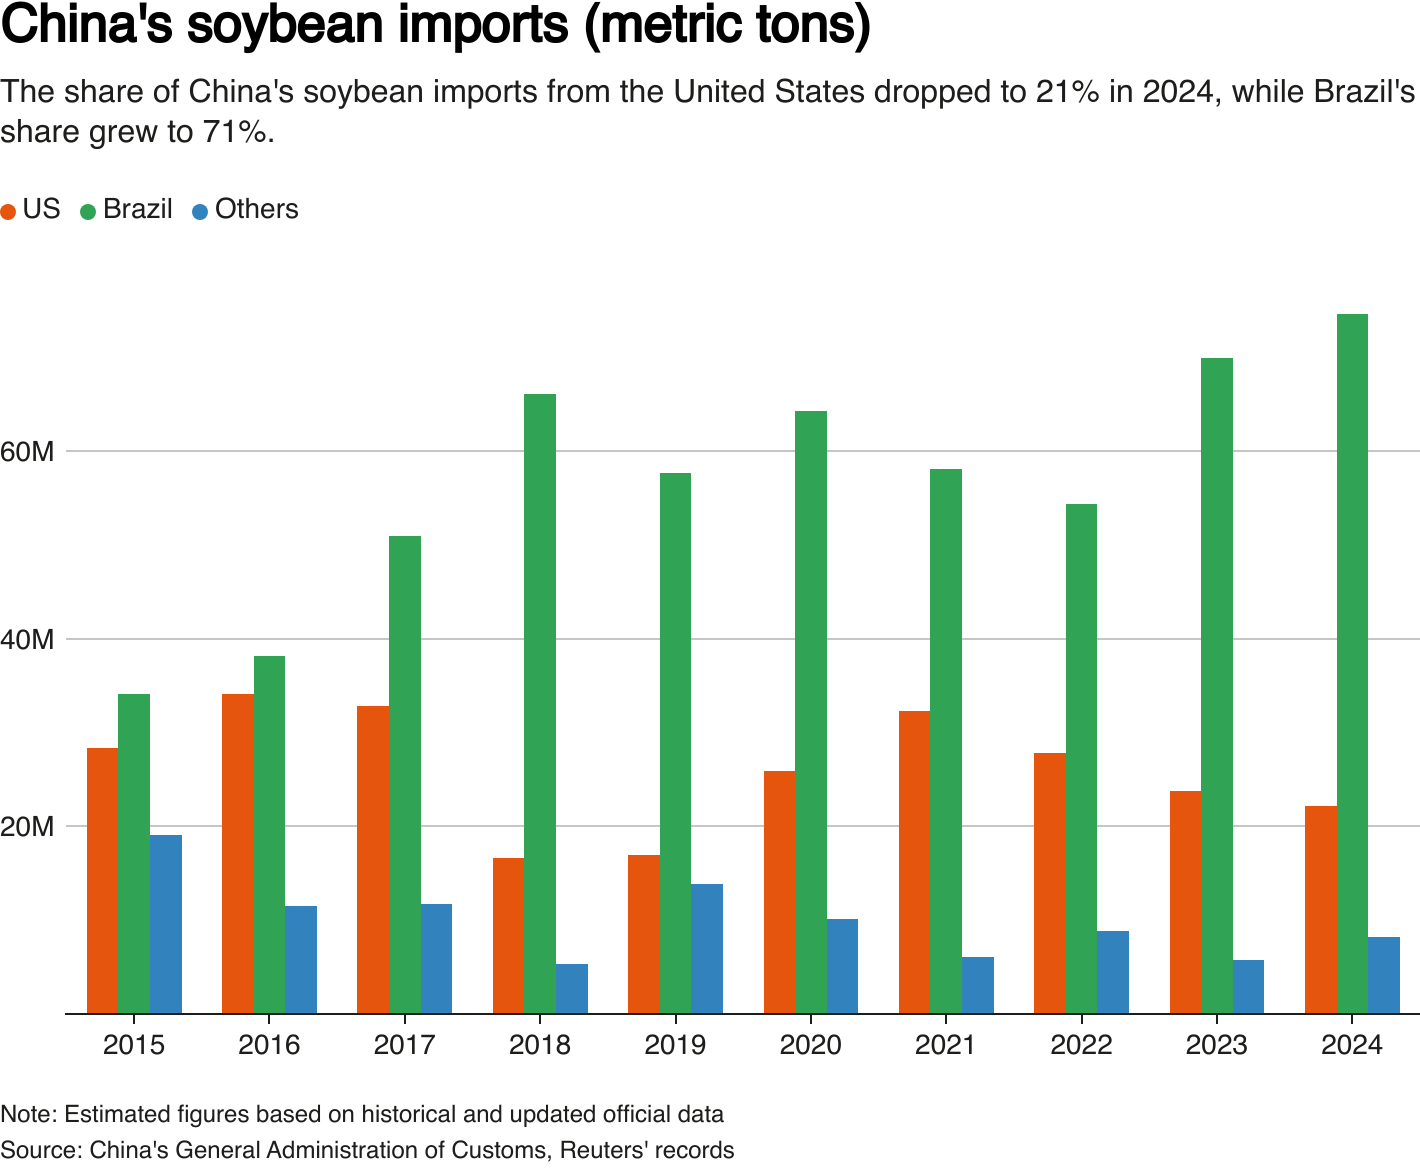
Source: Reuters
As tariffs increased the relative cost of U.S. agricultural goods, Brazilian exports became the lower-risk and more price-competitive alternative for China. Over time, this reallocation reinforced Brazil’s position as China’s primary soybean supplier, embedding trade patterns and shifting global trade flows. In the case of BRICS+, this effect is amplified through China’s demand for commodities and Brazil’s agricultural capacity, creating natural channels through which diverted trade can be absorbed within the bloc.
Looking Ahead
While BRICS+ nations are not a formally unified economic bloc, mounting tariff measures create a shared incentive to diversify trade relationships and reduce exposure to future U.S. tariff actions. Brazil, India, and South Africa have consistently signaled that diversification is a hedge, not a realignment away from the United States. Additionally, a BRICS+ common currency or accelerated de-dollarization strategy remains aspirational, while the concrete progress lies in expanding trade and investment ties among member states.
The more likely outcome of continued tariff escalation is not the emergence of a cohesive anti-Western bloc, but a gradual redirection of trade toward alternative partners within the BRICS+ network. This shift is already evident in the growing use of free trade agreements (FTAs) and bilateral investment treaties (BITs) by BRICS+ nations to lower trade barriers and reduce exposure to external market shocks.
China, for example, currently has 24 FTAs underway, 16 of which have already been signed and implemented, with roughly 30 trading partners as a counterweight to U.S. protectionism. Since the 2018 trade war began, China has signed at least nine new or upgraded FTAs, including agreements with Mauritius, Cambodia, Serbia, Ecuador, and Nicaragua, plus the 15-nation Regional Comprehensive Economic Partnership (RCEP), reflecting a continued push to expand trade ties alongside broader regional agreements. Ten more FTAs are currently under negotiation, with 8 more under consideration.
India has similarly accelerated its free trade strategy. In 2024, India implemented a BIT with the United Arab Emirates and is finalizing a sweeping FTA with the European Union, that would eliminate tariffs on 96.6 percent of traded goods. Expected to be completed by late 2026, the agreement aims to boost two-way trade and promote integration with Europe to expand opportunities beyond the U.S. market. Together, these initiatives suggest major BRICS+ economies are responding to rising trade tensions by building creative, alternative trade networks to reduce dependence on the United States —strengthening economic ties across the Global South and other emerging markets.
Conclusion
Across both terms, Trump’s tariffs have functioned less as a tool for isolating BRICS+ economies and more as a catalyst for trade diversification. The 2018-2019 trade war showed this clearly, as U.S. tariffs on China prompted Chinese retaliation against U.S. agriculture markets, shifting the soybean trade heavily toward Brazil. The second Trump administration’s broader tariff regime extends these incentives across a wider range of countries and industries. As trade tensions persist, BRICS+ countries are likely to continue expanding trade, investment, and institutional ties with one another in creative ways, deepening economic integration as a hedge against future disruptions in U.S. market access. If this hedging trend continues, the resulting expansion could gradually erode U.S. dollar dominance, diminish U.S. leverage over global commerce, and make foreign economies less vulnerable to future U.S. trade restrictions.

You must be logged in to post a comment.